Feb 20, 2026
Engineering
The Pulse of 500+ GPUs: Monitoring Large-Scale AI Training Clusters

Hanjeong Lee
Research Intern
Feb 20, 2026
Engineering
The Pulse of 500+ GPUs: Monitoring Large-Scale AI Training Clusters
Hanjeong Lee
Research Intern
Lablup is the infrastructure partner in the Upstage consortium for Korea's national Sovereign AI Foundation Model project. We're pre-training Upstage's Solar Open (a 102B MoE model) on SKT's "HAEIN" cluster, using around 500 of its 1,000+ NVIDIA B200 GPUs. When you operate a cluster at this scale, one reality hits you fast: failures are not a matter of if but when.
According to Meta's research [1], the mean time to failure (MTTF) for a 1,024-GPU training run is 7.9 hours. In our cluster, 13 nodes experienced 17 hardware failures over roughly two months. Each individual GPU failure matters because in distributed training, one GPU going down stops the entire job.
To reduce downtime from these inevitable failures, we've been building a proactive failure detection system that aims to predict which GPUs are likely to fail and preemptively swap them out. This post covers the first step: what data we collect from the cluster, how we collect it, and what early warning signs we've actually observed in real failures.
The Training Environment
Detecting failures requires understanding what you're monitoring. Knowing the hardware layout and network topology is a prerequisite for interpreting any metric.
Cluster Configuration
Upstage's Solar Open [2] is a 102B-parameter MoE model with 12B active parameters, consisting of 128 routed experts and 1 shared expert. The training cluster:
| Component | Value | Notes |
|---|---|---|
| Nodes | 63 | 60 training, 3 spare |
| GPUs | 504 | 8x B200 per node |
| GPU model | NVIDIA B200 | Blackwell architecture |
| System memory per node | 2 TiB | DDR5 |
| GPU memory | 192 GB | HBM3e |
| Storage | 2 PB | NFS (VAST Data) |
A node is a single physical server with 8 GPUs installed.
60 nodes (480 GPUs) participate in training; the remaining 3 serve as hot spares for node replacement. Training uses HSDP (Hybrid Sharding Data Parallel): 10 nodes (80 GPUs) form one FSDP sharding group, and we run 6 replicas total. Within each group, FSDP shards parameters across GPUs for memory efficiency. Across groups, only gradients are synchronized, keeping inter-group communication volume low.
Inside a Node
Each node's internal structure looks like this:
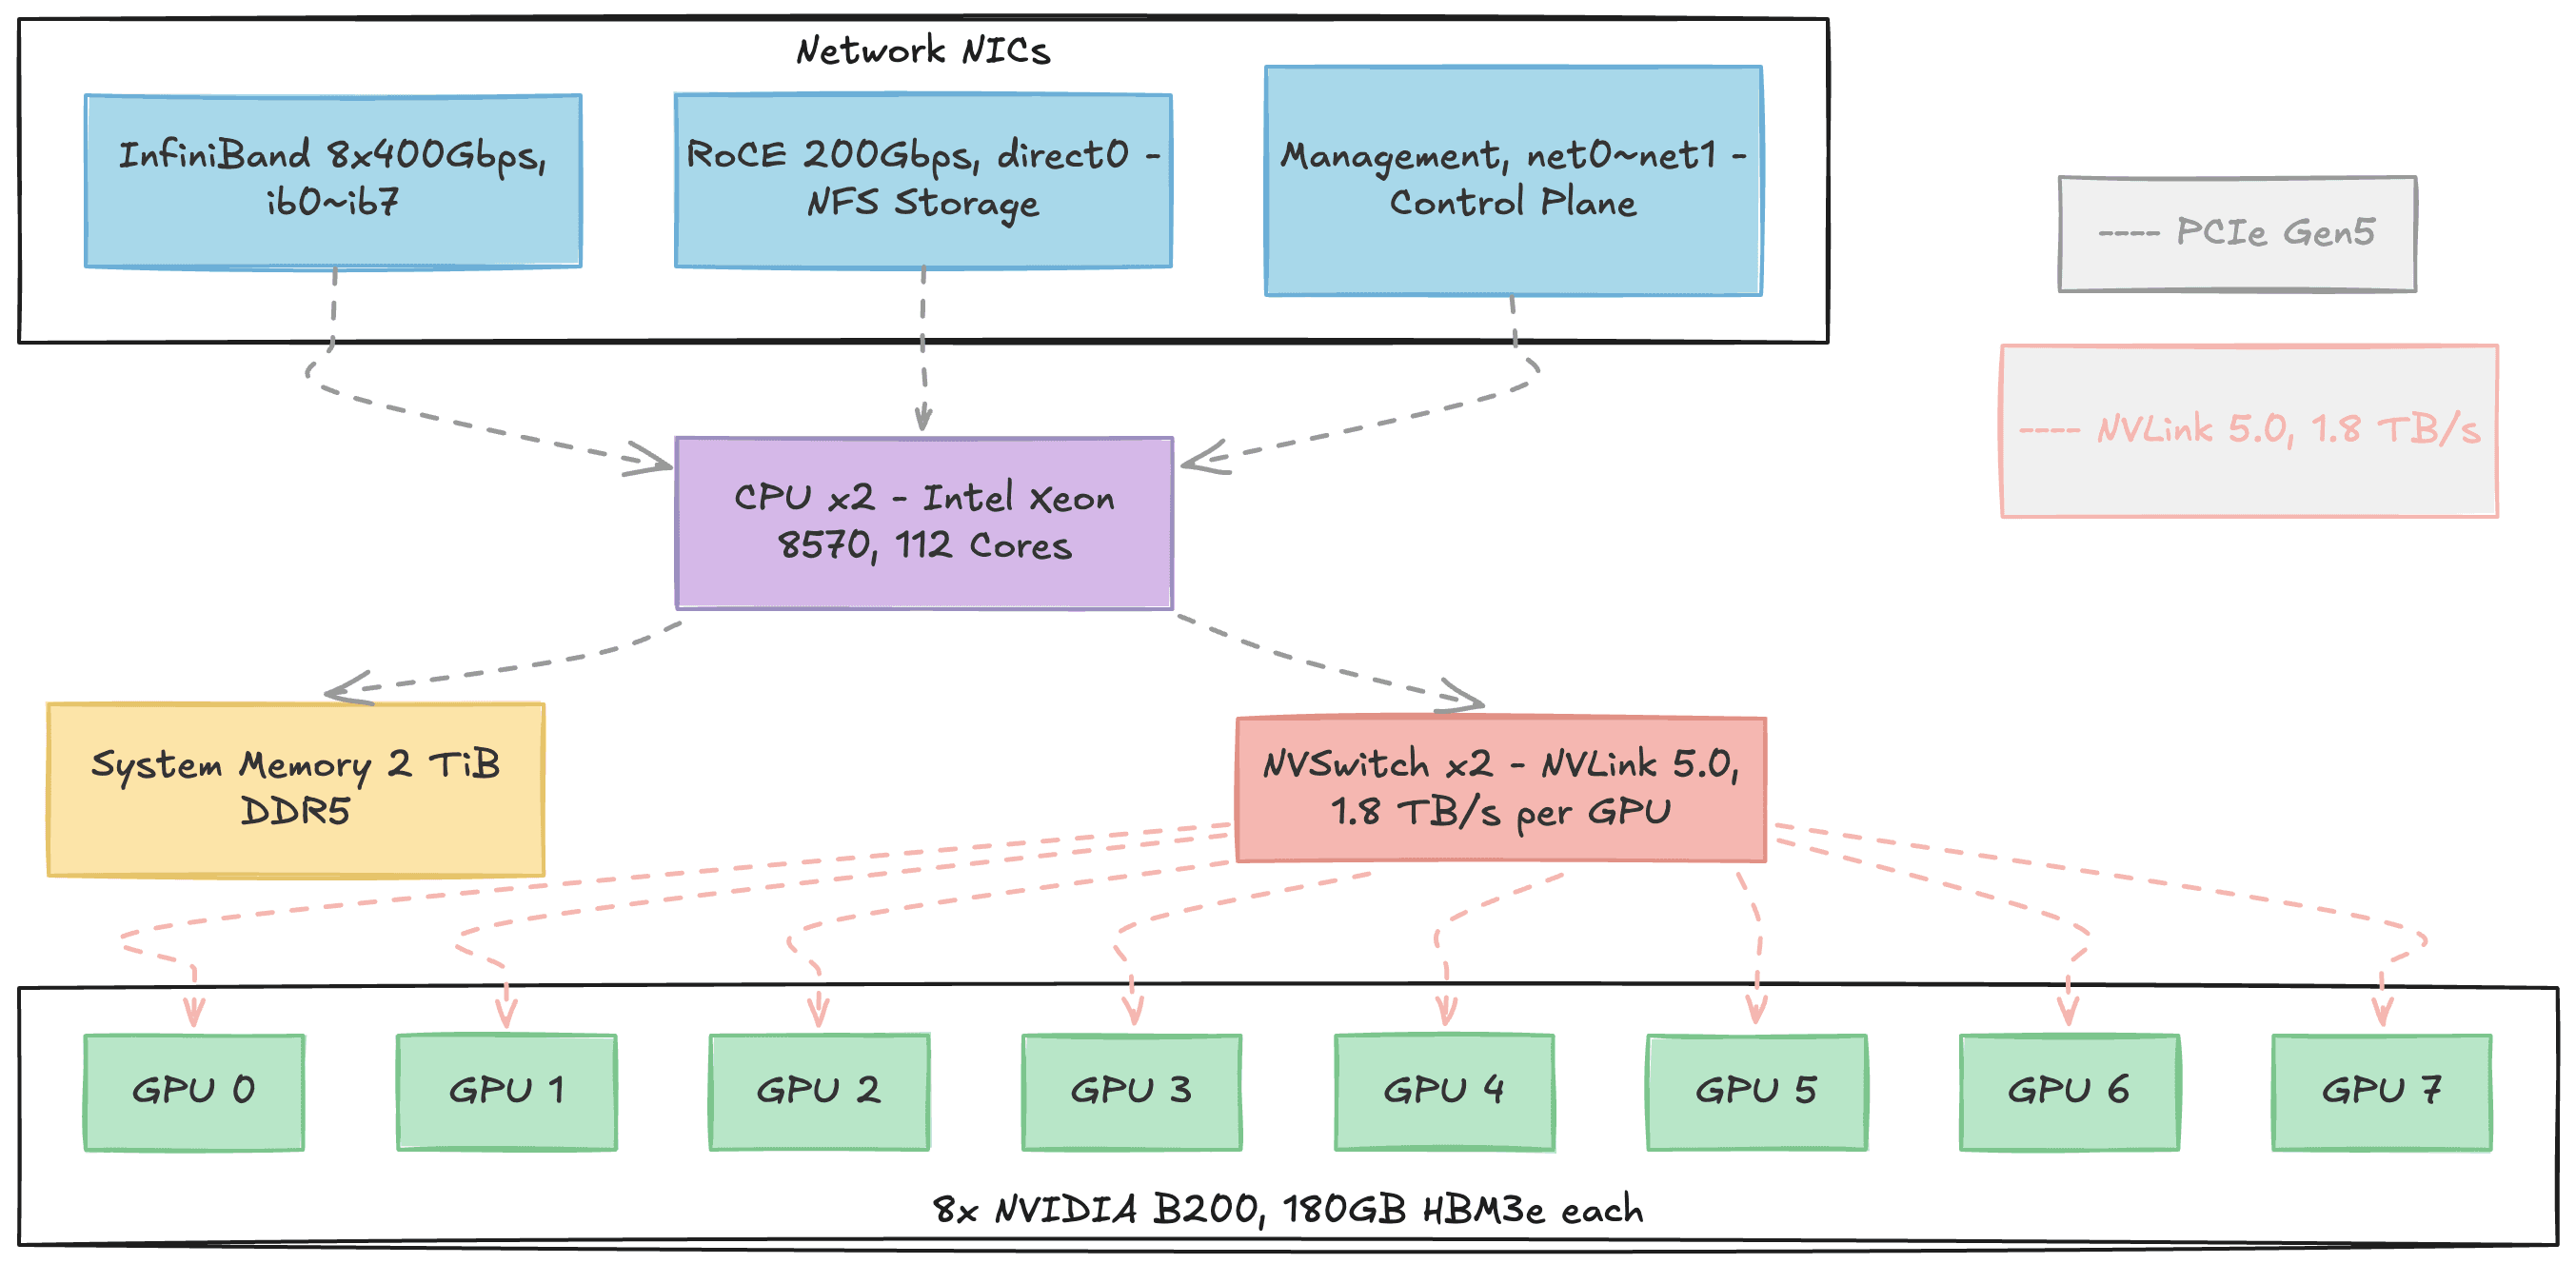
Figure 1. Internal structure of a single DGX B200 node. Three types of network NICs (InfiniBand, RoCE, Management) connect to the CPU via PCIe at the top. The 8 B200 GPUs at the bottom connect all-to-all through NVSwitch. Gray dashed lines represent PCIe Gen5 paths; pink dashed lines represent NVLink 5.0 paths.
Each node is an NVIDIA DGX B200 built around 8 B200 GPUs. Each GPU carries 192 GB of HBM3e memory where model parameters, gradients, and activations reside. All AI computation happens on these GPUs.
The CPUs are dual Intel Xeon 8570 sockets (112 cores total), but their role during training is supporting: reading training data from storage, preprocessing it, dispatching work to GPUs, and prefetching the next batch. The 2 TiB of DDR5 system memory serves as NFS page cache and data buffer in this pipeline.
Within a node, 2 NVSwitches connect all 8 GPUs using the NVLink 5.0 protocol in an all-to-all topology. Any GPU can communicate with any other GPU at 1.8 TB/s bidirectional bandwidth. For external communication, 8 InfiniBand NIC ports (400 Gbps each) handle inter-node GPU data transfer, while a RoCE NIC (200 Gbps) connects to the VAST Data NFS storage for training data.
Knowing the role of each component helps later when mapping metrics to failure types. GPU temperature and power metrics reflect the GPU itself. NVLink bandwidth metrics reflect intra-node GPU-to-GPU communication. NFS-related metrics reflect storage bottlenecks.
Network Structure: NVLink vs. InfiniBand
Two networks are central to distributed training:
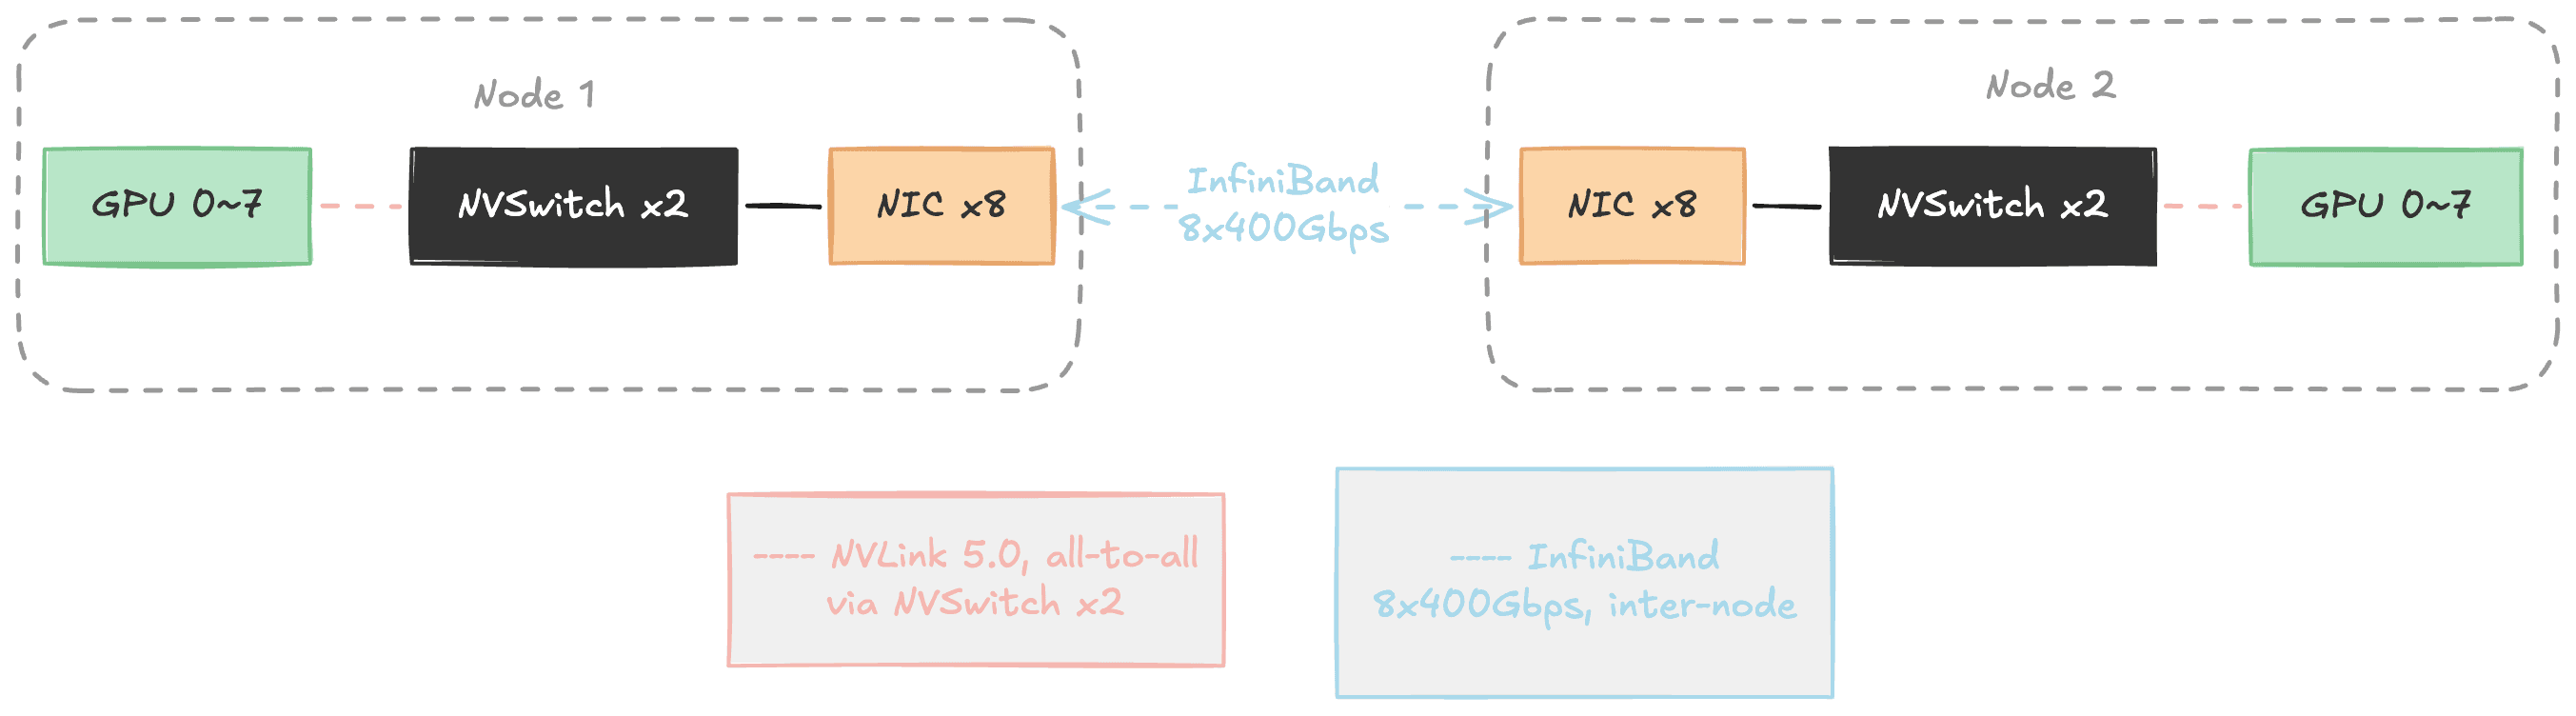
Figure 2. The two networks in distributed training. Inside a node, NVSwitch connects 8 GPUs via NVLink (pink). Between nodes, InfiniBand communicates through NICs (blue). A single GPU's NVLink bandwidth (1.8 TB/s) is roughly 4.5x the entire node's InfiniBand bandwidth (~400 GB/s).
NVLink provides all-to-all connectivity among the 8 GPUs within a node through 2 NVSwitches. Each GPU's NVLink bandwidth is 1.8 TB/s bidirectional. InfiniBand handles inter-node communication, and even with all 8 ports combined, totals about 400 GB/s, roughly 1/4 of a single NVLink port.
| NVLink | InfiniBand | |
|---|---|---|
| Scope | Intra-node (8 GPUs) | Inter-node |
| Connects | GPU to GPU (same node) | NIC to NIC (different nodes) |
| Bandwidth | 1.8 TB/s per GPU (bidirectional) | ~400 GB/s aggregate (8 ports) |
| Used for | FSDP communication (intra-node) | FSDP communication (inter-node) + DDP gradient sync |
This bandwidth gap shapes the distributed training architecture. HSDP exploits the two networks hierarchically: within the 10-node FSDP group, GPUs on the same node communicate over fast NVLink, while cross-node communication uses InfiniBand. Gradient synchronization across the 6 replicas (DDP all-reduce) also travels over InfiniBand. If InfiniBand develops problems, all inter-node communication is affected. If NVLink develops problems, intra-node GPU communication within that node breaks down. That is why we monitor both network layers.
The Reality of Failures
Failure Probability at Scale
More GPUs means a much higher probability of failure. Meta's research [1] quantifies the relationship:
| GPU Count | Mean Time to Failure (MTTF) |
|---|---|
| 8 | 47.7 days |
| 64 | 5.9 days |
| 256 | 35.6 hours |
| 1,024 | 7.9 hours |
With our 480-GPU setup, we can expect a failure every few hours.
Failure Types
What kinds of failures actually happen in large GPU clusters? ByteDance's Minder study [3] analyzed real failures from their training clusters (tens of thousands of GPUs):
| Category | Failure Type | Proportion |
|---|---|---|
| Hardware (55.8%) | ECC Error (memory fault) | 38.9% |
| PCIe Downgrading | 6.6% | |
| NIC Dropout | 5.7% | |
| GPU Card Drop | 2.0% | |
| NVLink Error | 1.7% | |
| Software (28.0%) | CUDA Execution Error | 14.6% |
| GPU Execution Error | 7.7% | |
| HDFS Error | 5.7% | |
| Network (6.0%) | Machine Unreachable | 6.0% |
| Other | Others | 10.3% |
Hardware failures account for over half (55.8%), with ECC errors dominating at 38.9%.
Actual Failures in Our Cluster
Over roughly two months of training, here are the actual hardware failures (excluding user errors) we recorded. XID in the table refers to NVIDIA's GPU error codes logged when hardware or driver issues occur:
| Category | Failure Type | Proportion |
|---|---|---|
| GPU Hardware (58.8%) | NVLink Error (XID 145/149) | 23.5% |
| GPU Fallen Off Bus (XID 79) | 11.8% | |
| ECC Error (XID 94) | 11.8% | |
| GSP RPC Timeout (XID 119) | 5.9% | |
| NVLink Failure (non-XID) | 5.9% | |
| Infrastructure (17.6%) | Node Unrecognized | 11.8% |
| Performance Degradation | 5.9% | |
| Other (23.5%) | Others | 23.5% |
Where the Minder study [3] found ECC errors (38.9%) as the dominant failure type, NVLink errors (23.5%) were the most frequent in our cluster. ECC errors came in at 11.8%, considerably lower than Minder's proportion. GPU hardware failures accounting for over half of incidents holds true in both cases, but the specific breakdown varies by cluster environment.
From Reactive to Proactive
The traditional reactive approach means you detect a failure only after it happens, and the entire training job stalls while you recover. Our goal is a proactive approach: detect anomalous signals before a failure occurs, swap the suspect node with a spare, and keep training running without interruption.
The underlying principle is straightforward:
In distributed training, every node performs the same work. Healthy nodes should therefore exhibit similar metric patterns.
If one node's GPU utilization is abnormally low, or its NVLink bandwidth drops while every other node's stays steady, that node likely has a problem. So what data do we actually collect, and how?
The Monitoring Stack: Why Four Exporters
We use Prometheus-based monitoring to get numerical visibility into cluster state. Prometheus polls each node's exporters every 30 seconds, asking questions like "What's the GPU temperature?" or "How many bytes went over the network?" and each exporter responds with numbers.
Why four different exporters? Each covers a different domain:
| Exporter | Maintained by | Role | Key Metrics |
|---|---|---|---|
| DCGM-exporter | NVIDIA | Deep GPU monitoring | Temperature, utilization, NVLink, XID errors, ECC |
| node_exporter | Prometheus | Linux system metrics | CPU, memory, disk, network, NFS |
| all-smi | Lablup | Multi-hardware unified monitoring | GPU state, CPU utilization/temp, system memory |
| Backend.AI | Lablup | Scheduler/container metrics | API requests, task processing, RPC |
DCGM-exporter and node_exporter are standard tools for GPU and system metrics respectively. So why do we also need all-smi and the Backend.AI exporter?
all-smi is a multi-hardware monitoring tool that supports not only NVIDIA GPUs but also Apple Silicon, Tenstorrent, Rebellions, and Furiosa NPUs. What matters for our cluster is that it collects the same core GPU metrics as DCGM-exporter redundantly. If one exporter dies, the other keeps watching. It also lets us cross-validate subtle differences (e.g., DCGM reports SM clock while all-smi reports graphics clock).
The five areas where DCGM-exporter and all-smi provide overlapping coverage:
| Area | DCGM-exporter | all-smi |
|---|---|---|
| GPU utilization | DCGM_FI_DEV_GPU_UTIL | all_smi_gpu_utilization |
| GPU temperature | DCGM_FI_DEV_GPU_TEMP | all_smi_gpu_temperature_celsius |
| Clock speed | DCGM_FI_DEV_SM_CLOCK | all_smi_gpu_frequency_mhz |
| Power consumption | DCGM_FI_DEV_POWER_USAGE | all_smi_gpu_power_consumption_watts |
| GPU memory | DCGM_FI_DEV_FB_USED | all_smi_gpu_memory_used_bytes |
The Backend.AI exporter collects scheduler-level metrics. GPU hardware metrics alone can't reveal certain signals, like a spike in the agent's async task count. Later in this post, we'll look at a case where this exporter caught a precursor to failure.
All collected data is stored in VictoriaMetrics, a Prometheus-compatible time-series database.
305 Active Metrics
The four exporters across 63 nodes report a total of 751 metrics. After filtering out items irrelevant to failure prediction (259 ZFS local filesystem metrics, Go/Python runtime internals, constants that never changed during our analysis period), we're left with 305 active metrics.
The breakdown of what these 305 metrics watch:
| Monitoring Target | Metric Count | Exporter | Primary Role |
|---|---|---|---|
| Network (TCP/IP) | 61 | node_exporter | Per-interface traffic, TCP retransmits/timeouts |
| NFS (VAST Data) | 54 | node_exporter | RPC latency, I/O, transport state |
| Memory | 45 | node_exporter + all-smi | Cache, mmap, OOM, utilization |
| Exporter/Runtime | 40 | go, process, python, scrape | Health of the monitoring system itself |
| Scheduler | 26 | Backend.AI | Task queue, RPC, container management |
| GPU (B200) | 18 | DCGM + all-smi | Temperature, utilization, XID, NVLink, ECC |
| Disk I/O | 18 | node_exporter | Per-disk read/write latency |
| OS/Kernel | 16 | node_exporter | PSI resource pressure, time sync, interrupts |
| InfiniBand | 15 | node_exporter | Per-port traffic, errors, link state |
| CPU | 12 | node_exporter + all-smi | Load, per-core utilization, scheduling |
GPU metrics account for just 18 (6%), which may look small. But DCGM provides such detailed per-GPU internals that a small number goes a long way. Network, NFS, and memory together make up 52% of the total because the infrastructure around GPUs is more complex and varied than the GPUs themselves. Since we can't predict where a failure's early signs will appear, collecting broadly matters more than collecting deeply in one area.
The Same Number Reads Differently
One point to address: not all 305 metrics are analyzed the same way.
Prometheus metrics come in two main types, counter (cumulative) and gauge (current value). A counter is like an odometer: it only goes up, so you care about the rate of change, not the raw value. Network bytes received (node_network_receive_bytes_total) is a typical counter. A gauge is like a speedometer: it goes up and down, and the current value itself is what you want. If GPU temperature (DCGM_FI_DEV_GPU_TEMP) reads 75, that means 75°C right now.
In practice, though, the official type wasn't granular enough for our analysis. Two counters can mean very different things: network traffic (increase is normal) versus InfiniBand link-down count (node_infiniband_link_downed_total, any increase is abnormal). So we defined our own analysis categories. The most important are error_counter (28 metrics) and state (11 metrics). For error_counters, any increase is a failure signal. For state metrics, a specific value (e.g., a non-zero XID error code) is a failure signal. These 39 metrics are direct failure signals. The remaining 266 capture indirect symptoms.
One more nuance: '305 metrics' does not mean 305 numbers. A single metric produces a separate time series for each label combination (node, GPU index, mount point, etc.). GPU temperature alone becomes 63 nodes × 8 GPUs = 504 time series. An NFS operation metric can expand to 63 nodes × 2 mounts × 22 operations = 2,772 time series. This explosion of time series from label combinations is called cardinality, and high-cardinality metrics occasionally caused out-of-memory errors during queries.
Comparing Like with Like
To detect anomalies across 305 metrics, we need to answer "is this node's value abnormal?" In distributed training, all nodes perform the same work, so the same metric should look similar across nodes, and an outlier signals trouble.
But within a single metric, labels can mix completely different targets. node_network_receive_bytes_total, for instance, includes all three NIC types from Figure 1 (ib0 through ib7, direct0, net0) plus virtual interfaces created by containers, totaling 146 devices. The storage interface direct0 pushes 1.5 TB/day while the management interface net0 handles 5 GB/day, a 300x difference. Comparing them against the same baseline would be meaningless. So for each metric, we defined which label granularity to compare at:
| Comparison Unit | Metric Count | Comparison Pool Size | Example |
|---|---|---|---|
| node | 178 | ~60 nodes | System memory, TCP, load |
| nfs_export | 45 | ~60 × 2 mounts | NFS I/O, RPC, operation latency |
| gpu | 18 | ~60 × 8 = ~480 GPUs | GPU temperature, utilization, NVLink |
| disk | 16 | ~60 × 2 disks | Disk I/O |
| ib_device | 15 | ~60 × 8 = ~480 ports | InfiniBand traffic, errors |
| network_device | 13 | Per interface type × ~60 nodes | Compare direct0 against direct0, net0 against net0 |
| cpu_core etc. | 20 | Per core, per sensor | CPU utilization, filesystem |
With this setup, we can precisely answer questions like "is GPU 3 on gpu065 hotter than the other 479 GPUs?" or "is gpu071's ib0 port bandwidth lower than ib0 on other nodes?"
Where a Failure Originates and Where It Shows Up Are Different Places
Which metrics are useful for which failure types is still an open question. The Minder study [3] provides a useful clue:
| Failure Type | CPU | GPU | Memory | Throughput | PFC | Disk |
|---|---|---|---|---|---|---|
| ECC Error | 80.0% | 65.7% | 57.1% | 45.7% | 8.6% | 11.4% |
| NVLink Error | 83.3% | 50.0% | 66.7% | 50.0% | 16.7% | 0.0% |
| GPU Card Drop | 75.0% | 70.0% | 55.0% | 50.0% | 5.0% | 20.0% |
ECC errors are GPU memory defects, yet CPU metrics (80%) detect them at a higher rate than GPU metrics (65.7%). Same pattern for NVLink errors: CPU detection rate (83.3%) exceeds GPU (50.0%). The component that causes the failure and the component where symptoms first appear can be different. No single metric type achieves 100% detection for any failure type either. Anomalies show up in at least one metric, but which one varies case by case.
The reason: within a node, GPU, memory, disk, and network are tightly coupled, and cascade effects propagate across them. So rather than trying to map specific failures to specific metrics, our approach is to collect as broadly as possible across all components.
Here's what we monitor for each of the most common failure types in our cluster, ordered by frequency.
NVLink failures: intra-node GPU communication loss. The most frequent failure type in our cluster (23.5%). We detect these by comparing NVLink bandwidth (DCGM_FI_DEV_NVLINK_BANDWIDTH_TOTAL) across all 8 GPUs in a node. If all 8 GPUs show reduced bandwidth, the NVSwitch itself is likely the problem. If only one GPU's bandwidth drops, the issue is that GPU's NVLink connection.
ECC errors: GPU memory defects. Minder reported these at 38.9%, the highest; in our cluster they were 11.8%. GPU HBM (high-bandwidth memory) consists of billions of memory cells that degrade gradually under sustained high temperatures. ECC (Error Correcting Code) automatically corrects errors at first, but as correctable errors accumulate, they eventually lead to uncorrectable ones. That's why we track HBM temperature (DCGM_FI_DEV_MEMORY_TEMP) and row remapping count (DCGM_FI_DEV_CORRECTABLE_REMAPPED_ROWS). As the Minder [3] data showed, ECC errors are often detected by CPU metrics before GPU metrics, so root cause analysis requires looking beyond the GPU.
NIC failures: inter-node communication loss. InfiniBand link-down count (node_infiniband_link_downed_total) is the primary indicator. This is a textbook error_counter: any increase at all is an anomaly. A single link going down can block gradient synchronization (the step where nodes reconcile their computed results), halting the entire training job.
Filesystem issues: training data supply disruption. Training data flows from NFS (VAST Data) to system memory (cache) to GPU memory. If NFS develops problems, GPUs idle waiting for data. An NFS request goes through three stages: queue wait, transmission/processing, and response. Where the latency spike occurs indicates the cause. Increased queue wait time suggests client overload. Increased transmission time suggests a network problem. Increased response time suggests storage-side load.
Individual failures like these are hard enough, but cascade effects are even trickier. If GPU computation slows, data preprocessing backs up, I/O queues grow, and system load rises. The reverse direction works too: NFS latency causes GPUs to idle, waiting for data. To catch these cascading patterns, we also collect indirect indicators like TCP retransmissions (node_netstat_Tcp_RetransSegs), disk I/O saturation, system load (node_load1), and time synchronization drift.
A Real Precursor We Found
Backend.AI Async Tasks Spiking Right Before Failure
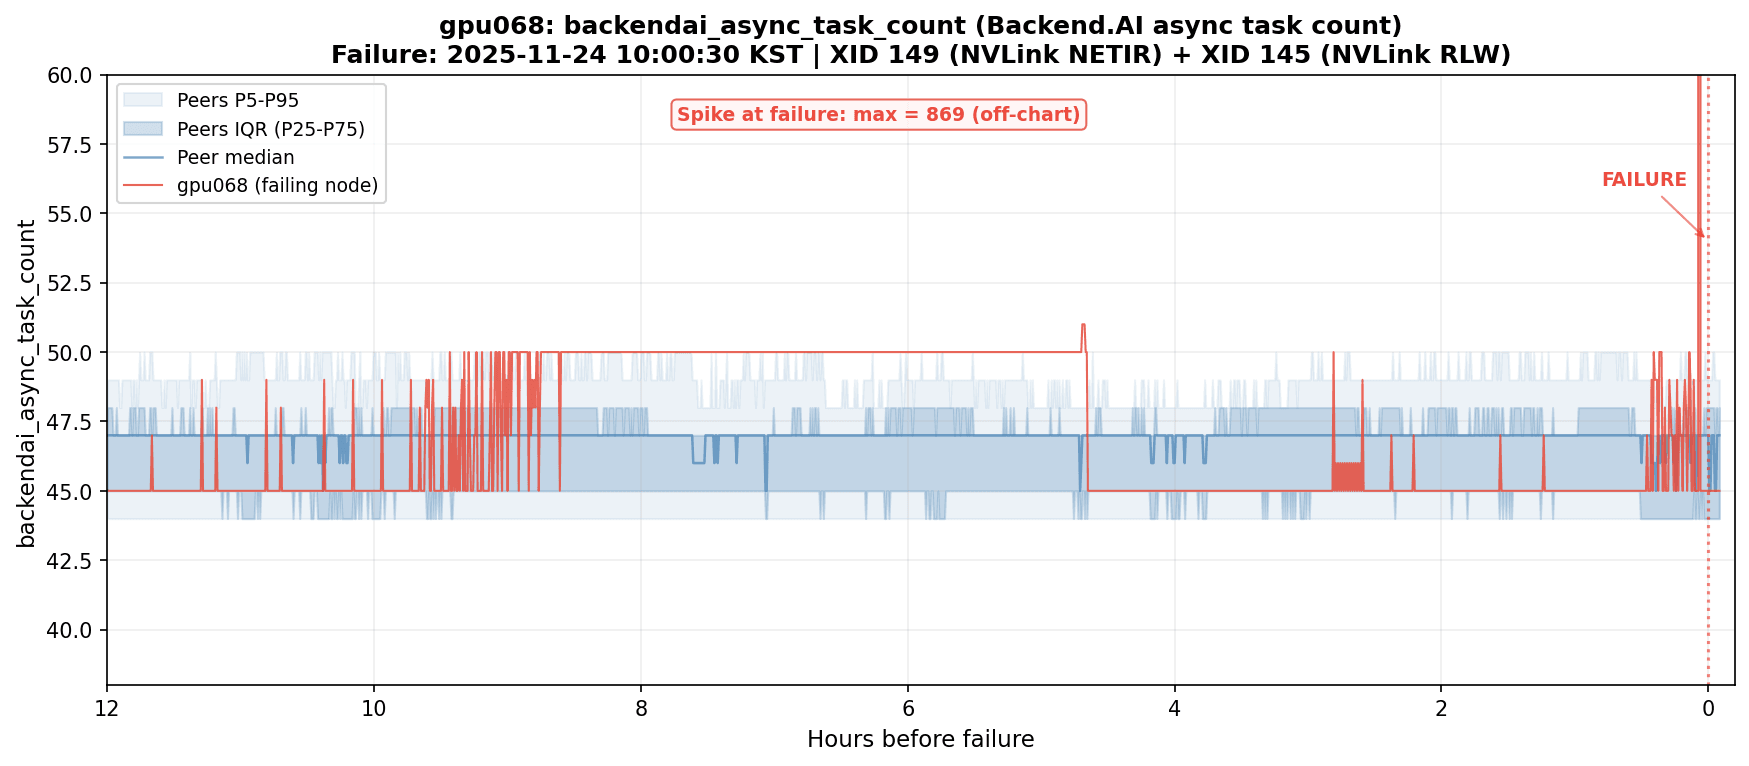
Figure 3. backendai_async_task_count spiking on gpu068 just before an NVLink failure. The value surged from the normal range (44-50) to 869, roughly an 18x increase.
Just before gpu068 experienced an NVLink failure (XID 149 + XID 145), backendai_async_task_count (the number of async tasks being processed by the Backend.AI agent) spiked sharply. Under normal conditions, this value sits steadily at 44-50 across all 60 nodes. At the time of the failure, gpu068 alone hit 869. That's roughly 18x normal.
The NVLink anomaly appears to have triggered a flood of error handling, retries, and status reporting in the agent. A GPU hardware failure produced a visible signal at the scheduler level.
This case matters because the GPU failure's earliest signal appeared outside GPU metrics entirely. backendai_async_task_count belongs to the Backend.AI scheduler domain, not DCGM. We caught it because we had cast a wide net with 305 metrics spanning GPU, network, storage, and scheduler. The rationale for running four exporters, and the cross-domain detection rates that Minder [3] reported, found concrete confirmation here.
Where We Go From Here
Operating a 500+ GPU training cluster has taught us that predicting failures requires more than watching GPUs. The cluster runs 63 nodes with 504 B200 GPUs, dual NVLink and InfiniBand networks, and HSDP distributed training. Over two months, 13 nodes produced 17 hardware failures, each one capable of stopping the entire training run.
We collect 305 metrics every 30 seconds through four exporters (DCGM, node_exporter, all-smi, Backend.AI). We group them by comparison unit so that outlier detection compares like with like. And in at least one real case, the earliest warning came not from GPU metrics but from a scheduler-level metric that nobody would have checked under a GPU-only monitoring strategy.
The biggest lesson from operating this cluster: the place where a failure originates and the place where its symptoms first surface are often different. We are now using this dataset to design and validate anomaly detection models, with the aim of predicting failures before they interrupt training.
References
[1] Reliability Lessons Learned from Scaling Large-scale ML Research Clusters (Meta, HPCA 2025)
[2] Solar Open Technical Report (Upstage, 2026)
[3] Minder: Faulty Machine Detection for Large-scale Distributed Model Training (ByteDance, NSDI 2024)